Driving Performance: Using JMeter for Scalability and Resilience Testing
In the dynamic world of construction, where safety and efficiency are paramount, Navatech emerges as a groundbreaking solution. Our innovative conversational health and safety platform empowers construction workers with instant access to vital information—all at the palm of their hands. Through a seamlessly integrated mobile app and cloud-based backend systems, Navatech revolutionizes the way construction professionals engage with critical safety protocols and procedural knowledge.
At Navatech, ensuring optimal performance and reliability of our platform is non-negotiable. That's where JMeter steps in as our trusted ally. By employing JMeter for rigorous load testing, we validate our products' scalability and resilience under real-world conditions. This strategic approach not only guarantees uninterrupted access to essential information but also underscores our commitment to safeguarding the well-being and productivity of construction workers worldwide. Join us as we delve deeper into how Navatech leverages JMeter to deliver unparalleled safety and efficiency in the construction industry.
How we use utilizes JMeter for performance testing?
Performance testing is a crucial aspect of our development process, and JMeter plays a central role in this endeavor. Among various types of performance testing, load testing stands out as essential. This method allows us to evaluate a system's performance under real-world conditions, assessing its ability to handle varying levels of user activity. Load testing serves a clear purpose: to determine the system's capacity under different loads. It provides valuable insights into how much stress a device or software can withstand while maintaining functionality as per user expectations. Additionally, load testing helps us identify the maximum operating capacity of our applications, ensuring that the current infrastructure is sufficient to support their intended usage. Moreover, it aids in determining the optimal number of concurrent users that our applications can effectively accommodate, contributing to an enhanced user experience and overall system efficiency.
Let’s understand JMeter and how it helps :
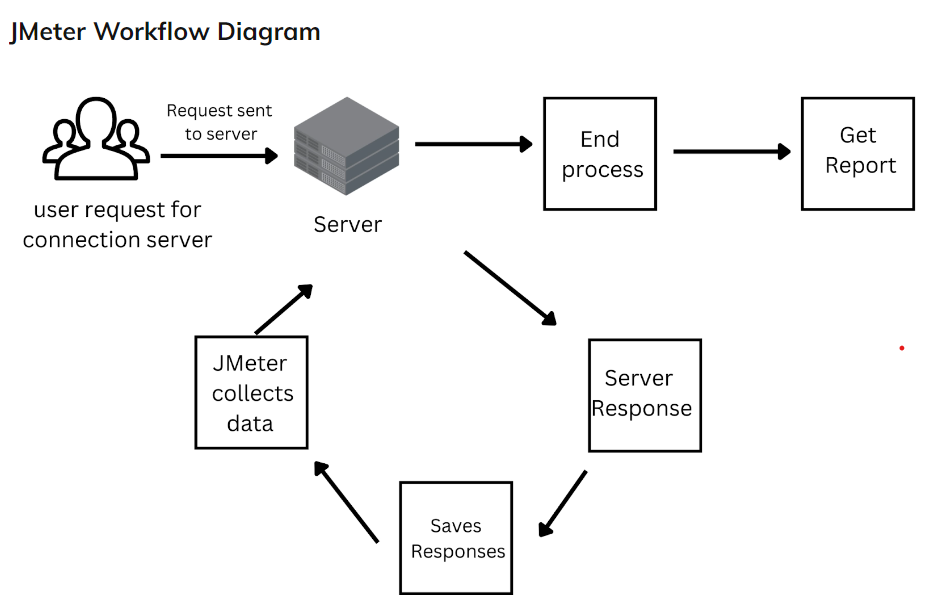
Apache JMeter stands tall as a Java-based open-source tool designed to meticulously analyze and gauge the performance of web applications. The essence of JMeter's functionality can be encapsulated in the following diagram.
Consider a live application accessed by numerous users simultaneously, each potentially generating multiple requests. This scenario underscores the critical importance of thoroughly testing applications under such conditions. With JMeter, we're empowered to craft intricate test scenarios, comprising multiple users, multiple requests, or a combination of both.
Let's delve into some practical examples to elucidate this concept further.
Suppose we have to test the load for 100 users who can concurrently use the API /api/v1/config/language-list for getting requests to fetch the languages list, Here's a step-by-step guide to load testing the API /api/v1/config/language-list for 100 concurrent users using Apache JMeter:
- Go to the Apache JMeter folder >> bin folder >> open the batch file>>select the Test Plan.
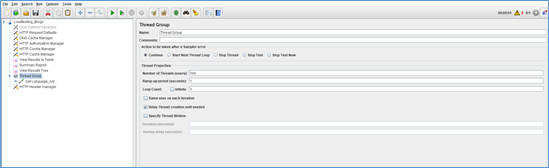
- Next, right click on the Test Plan and add a Thread Group.
- Now Provide the number of Threads and ramp-up time, In the Provided example we have used 100 threads (users) with a ramp-up time of 1 seconds.
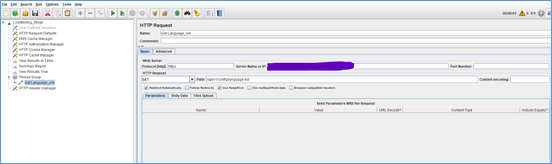
- Right-click on Thread Group and select Sampler and to add HTTP Request and provide the details for IP, Request Type, and Path
- Now Add the Listeners to View the Load Report. In the Provided Example we have used 2 Listeners named – View Results in Table, Summary Report and View Result tree
- Now Execute the API Request from The RUN button in the Toolbar
- Also we have tested all the APIs with different DB connection, Increase/Decrease DB connections, Increase/Decrease Pods and with Low to High AWS servers.
Results
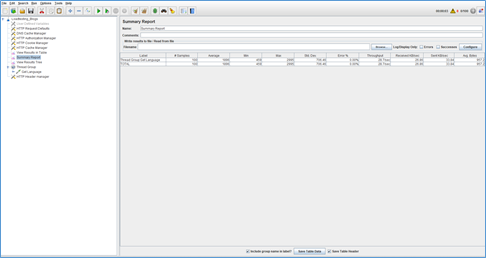
- Summary Report
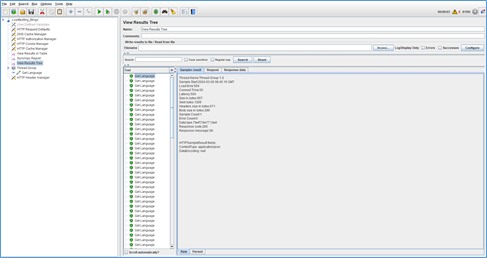
- View Results Tree
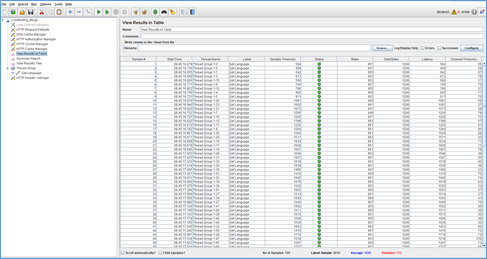
- View Results in Table
Analyzing the Results
After the test is complete, you can analyze the results to identify any performance issues. JMeter provides various performance metrics such as throughput, latency, and error rate, which can be used to identify performance bottlenecks. You can also generate reports and graphs to visualize the test results.
Why Do We Use JMeter for Load Testing?
JMeter is a preferred choice for load testing due to several key advantages:
- Cost-effective: Being an open-source tool, JMeter eliminates the need for licensing fees, making it an economical option for load testing.
- Versatility: JMeter is not limited to just web applications; it supports performance testing across various application types, including web services, databases, LDAP, and shell scripts.
- Platform independence: Its Java-based architecture ensures compatibility across different operating systems, providing flexibility in deployment.
- Wide-ranging support: Beyond performance testing, JMeter caters to other non-functional testing requirements such as stress testing, web service testing, and distributed testing.
- Efficient recording and playback: JMeter offers intuitive features for recording and playback, equipped with drag-and-drop functionality, streamlining the testing process and enhancing efficiency.
- Customization: As an open-source tool, JMeter allows developers to customize its functionalities to suit specific testing needs, ensuring adaptability to diverse testing scenarios.
- Robust community support: With an extensive library of tutorials and a vibrant community, JMeter users benefit from readily available resources and free plugins that augment analysis capabilities, fostering continuous improvement and innovation.
These compelling features collectively make JMeter a favored solution for load testing, empowering teams to conduct thorough performance assessments with ease and precision.
Conclusion
In this blog, we have explored the indispensable role of Apache JMeter in the realm of performance testing, highlighting its myriad benefits and functionalities. As an open-source tool, JMeter offers a cost-effective solution for evaluating the performance of various applications, including web services and databases. With its user-friendly interface and interactive features, JMeter simplifies the testing process, making it accessible to both novice and experienced testers alike. Its versatility extends to simulating heavy loads and providing comprehensive performance metrics, enabling organizations to identify and address potential bottlenecks effectively. Moreover, JMeter's reliability ensures that applications can handle large volumes of traffic without compromising performance, thereby enhancing user satisfaction and trust. In essence, JMeter emerges as a powerful ally for ensuring the optimal performance of applications in today's dynamic digital landscape.
Join Our Team of Innovators!

Are you a passionate developer seeking exciting opportunities to shape the future of technology? We're looking for talented individuals to join our dynamic engineering team at Navatech Group. If you're eager to be part of groundbreaking projects and make a real impact, we want to hear from you!
Send your resume to careers@navatechgroup.com and take the first step toward a rewarding career with us. Join Navatech Group today and be at the forefront of innovation!